
Isotype pictograms
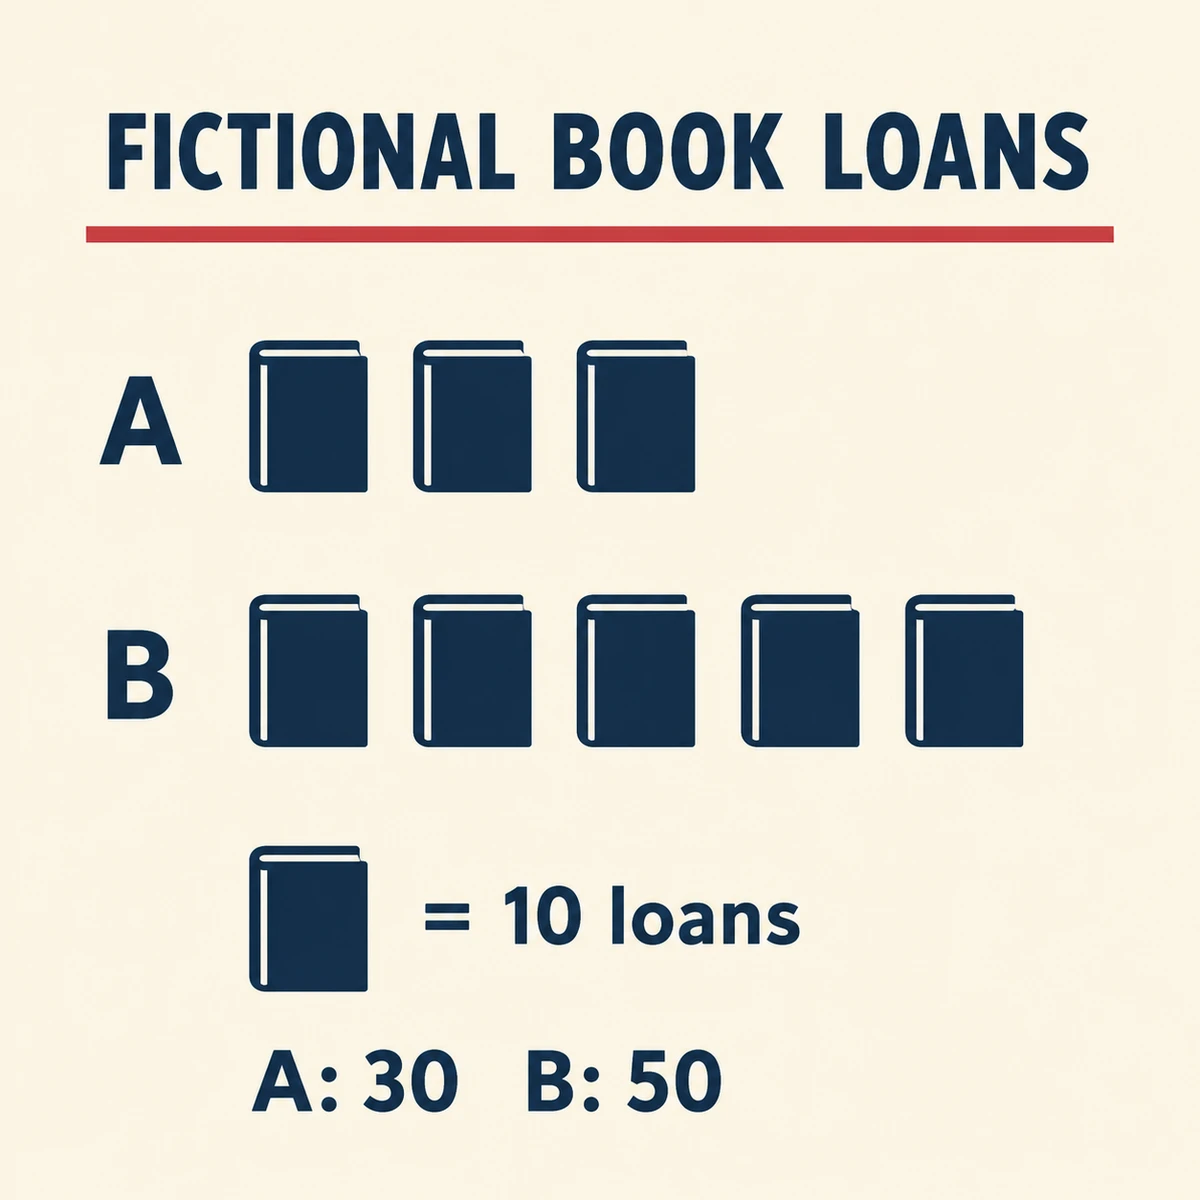
Fictional book-loan comparison
Three and five equal-sized book symbols compare invented totals of 30 and 50 loans, with a visible key of one book per ten loans.
Make
Isotype-inspired visual treatment with consistent simplified pictograms, repeated equal-sized units, disciplined modular spacing and clear comparative hierarchy.
A legible two-row comparison with a unit key replaces the unkeyed symbol sheet. Repeated same-sized pictograms encode quantity, rather than becoming decorative motifs.
A starting point: add your own subject or details in your image tool.
An original generated interpretation with a different composition.
Counts and arithmetic checked by the assistant for this image: 3×10=30 and 5×10=50. The data are invented and do not describe a real institution.
About this aesthetic and its examples
Compare more directions
Explore other approaches for this kind of project.

Look closer: traits and nearby styles →
About this example
This image may have used extra directions. The seed above is a reusable starting point and may produce a different result.
- Created with
- Built-in image generation (image_gen__imagegen)
- Model
- Not exposed by tool
- Generated
- 2026-10-26
How to use this promptRead as Markdown
Picture symbols and quantities
Isotype uses simplified pictograms consistently as repeatable units. For a quantitative comparison, a greater amount is represented by more symbols of the same size, rather than by enlarging a symbol.
The original symbol sheet has no unit key and does not establish verified statistics about people, homes, energy or any other subject. The book-loan variation demonstrates a keyed comparison: three and five equal-sized book symbols represent invented totals of 30 and 50 loans, at ten loans per symbol.
To make an actual information graphic, supply the data and a clear unit key, then check every count, label and comparison. An image generator’s output is not evidence that the underlying quantities are correct.
Learn more: University of Reading: Isotype Revisited
Look closer at Isotype pictograms
A fictional symbol study inspired by Isotype’s consistent pictograms, repeated units and modular spacing. This example has no unit key and does not communicate verified statistics.
In the original generated example: A fictional data poster built from repeated simplified symbols and modular counts. Notice which details catch your eye before deciding whether the whole style is for you.
Explore across projects: Letters with personality
Ask yourself: is it the palette, the surface, the shapes, or the subject you like? Save a favorite and use the visual taste guide to find a useful next direction.